The United States has enjoyed a unique position for many years. When bad shocks hit, demand for Treasuries rises as financial markets seek a safe haven. That increase in demand means the U.S. can issue debt at low interest rates precisely when it needs to do this most, i.e. during bad shocks. And since some of the demand for U.S. Treasuries comes from abroad, it also means the dollar gets a lift during bad shocks, when most other countries would see their currencies fall.
The U.S. exorbitant privilege has looked wobbly recently. The dollar has fallen precipitously, even as yields have risen. This has caused some to draw parallels to the U.K. bond market blowup in September 2022, when yields rose sharply, even as the pound plummeted. This blog investigates if a risk premium is building in U.S. Treasury yields. It builds a surprise index that tracks the evolution of all major U.S. data releases relative to Bloomberg consensus. It then estimates the sensitivity of daily yield changes to data surprises and finds that this has fallen sharply of late, because yields have stayed high even as U.S. data have deteriorated sharply. This is consistent with a building risk premium and an exorbitant privilege that could finally be starting to wobble.
Did the US have a ‘Liz Truss’ moment in April?
Shortly after “Liberation Day” on April 2, the dollar fell sharply amid rising U.S. yields, which caused some to speculate that the U.S. was having its own “Liz Truss” moment, a reference to the blowup in the U.K. government bond market in September and October 2022. Figure 1 looks at the nominal trade-weighted British pound during this time period, in addition to the 10-year rate differential of the U.K. vis-à-vis its main trading partners (we use the same weights as in the currency index to weight rate differentials). U.K. interest rates spiked sharply, even as the pound was falling, a sign that markets were unwilling to invest in the U.K. and were pulling out of U.K. government bonds. Figure 2 is the same chart for the U.S. and shows how different the recent U.S. episode was. The U.S. rate differential has been fairly stable, while the dollar has fallen. Whatever exodus there has recently been from the U.S., it certainly doesn’t come close to a “Liz Truss” moment.
Figure 1

Source: Haver Analytics
Figure 2

Source: Haver Analytics
Of course, the U.K. is a small open economy and may therefore be a poor benchmark against which to judge the United States. Economic data should be a key determinant of longer-term yields, since they drive expectations of future growth and policy. We build a surprise index that spans all major releases. For every release, we calculate the surprise relative to Bloomberg consensus and scale that surprise by its historical standard deviation, making surprises comparable across releases. We then aggregate these surprises into an overall index and construct a 60-day moving average. Figure 3 shows this index and compares it to the widely followed index by Citi. Our index behaves similarly, though it is less volatile. Figure 4 compares our index to the evolution of the 10-year Treasury yield and shows how this yield has barely fallen, even as U.S. data surprises went negative, a sign the economy weakened faster than expected. This could be consistent with a building risk premium, which we attempt to quantify more formally next.
Figure 3

Source: Haver Analytics
Figure 4

Source: Haver Analytics
How wobbly is the exorbitant privilege?
We estimate a Kalman filter that links the sensitivity of daily changes in 10-year yield to our data surprise index. We control for changes in eurozone periphery yields, where wider spreads in the past contributed to safe haven buying of Treasuries (contaminating our beta) and for general fluctuations in risk appetite by way of the VIX. Figure 5 shows our estimate for the evolution of this data sensitivity over time. This sensitivity rose sharply during the inflation scare in 2021/22, when markets were very focused on whether the U.S. was overheating. It has fallen sharply recently. Figure 6 expands this estimation to differentiate between positive and negative surprises. It shows that the drop in data sensitivity stems from the reaction of 10-year yield to negative surprises, with this beta down sharply and no longer statistically different from zero. This reflects the fact that 10-year yield hasn’t fallen much, even as U.S. data surprises turned negative.
Figure 5
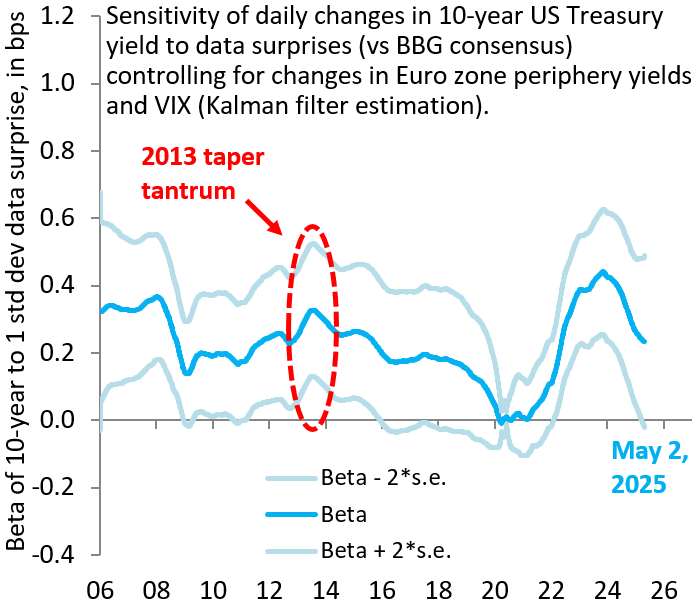
Source: Haver Analytics
Figure 6

Source: Haver Analytics
As Figure 6 shows, it is not unusual for the beta to negative data surprises to fall sharply in recession episodes. While tariffs are clearly a potential negative for U.S. growth, their ultimate size and severity remains unclear. The fall in data sensitivity to negative surprises is therefore noteworthy and could be consistent with a rising risk premium in U.S. Treasuries. Figure 7 shows that foreign flows into U.S. Treasuries make up just a small subset of overall inflows, which also go into U.S. stocks, corporate debt, and other assets. As such, even if there are early signs of a risk premium in Treasuries, this does not mean that the dollar is necessarily in trouble. After all, foreign investors may simply be shifting to other U.S. assets. That said, the direction of U.S. policy and a steadily widening current account deficit—especially when you control for the shift to becoming an oil exporter (Figure 8)—means that a Treasury market risk premium could easily morph into dollar weakness.
Figure 7

Source: Haver Analytics
Figure 8

Source: Haver Analytics
Author

The Brookings Institution is committed to quality, independence, and impact.
We are supported by a diverse array of funders. In line with our values and policies, each Brookings publication represents the sole views of its author(s).


Commentary
Is the United States’ exorbitant privilege in trouble?
May 8, 2025